Abstract: This concise practical guide explains what “charge volume” (filling level) means for ball and rod mills, why it matters, and how to measure, control and optimise it in real plant practice. It uses equipment data and operating principles from current industrial mill documentation, and gives actionable steps operators can apply at site, plus a short equipment-parameter table for quick reference.
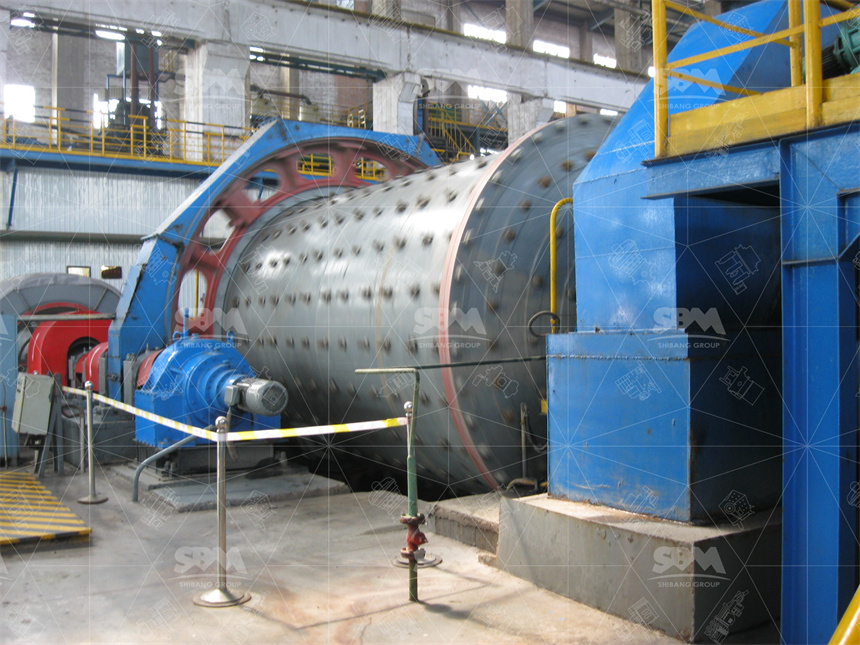
Charge volume = the combined volume occupied by grinding media plus material inside the mill, expressed as percent of the mill internal volume. It controls impact energy, residence time and throughput; therefore it directly affects grind size, energy consumption and liner wear. Small changes in charge quickly change power draw and product distribution, so operators must monitor it closely.
For industrial ball mills, aim for about 30–45% total filling by volume (media + slurry) in many wet grinding cases; for overflow mills operators often keep media filling lower, near 30–35%. Rod mills run lower — typically 30–40% rods by volume — because rods must be free to slide and avoid tangling. Use these as starting points, then tune to your ore and circuit.
Measure charge with simple, repeatable techniques. Practically, combine two or three methods rather than relying on a single indicator. Below are methods proven in site practice.
Stop mill, open manhole, measure distance from shell centre to media surface at 3 points. Convert to volume by geometry. This is direct but requires downtime; do monthly or after relining.
Normalized motor power (kW per m³) correlates to charge. Record steady-state power vs known charge, then use curve to estimate in real time. Beware: pulp density, liner shape and speed also change power, so calibrate for your mill.
Experienced operators use tone and impact sound to detect under- or over-fill. Use as a quick check; confirm with power/readings. This is fast, low-cost, often reliable when staff are trained.
If you add media in known lots, keep records. Total mass of balls/rods plus known densities gives volume. Combine with geometry to compute filling %. This is accurate for media-only charge.
Use vibration sensors, acoustic probes or sonar-based fill sensors. These tools reduce uncertainty and allow closed-loop control when integrated with mill PLC. They need calibration and maintenance, though.
Step 1: determine internal mill volume (V = π·(D/2)²·L). Step 2: compute media volume from mass and media density. Step 3: if material present, estimate slurry interstitial fill and add. Filling % = (media volume + material free volume) / internal volume × 100. For fast checks, keep a small spreadsheet or handheld calculator program.
Under-filled mills:
Low power, low throughput, coarser product, increased liner wear from slumping.
Add grinding media in controlled batches; slightly increase feed retention time; check speed and liners. Re-check power curve after each addition.
Over-filled mills:
High power, poor grind (slurry cushioning), high media and liner wear, possible gear stress.
Reduce media, reduce feed rate, adjust classifier cut, or change to coarser media size to restore cascade action. Always avoid sudden large removals; remove in steps and monitor power and product size.
Use manufacturer nominal sizes and motor ratings when planning media changes. Example models and nominal parameters (for planning only):
| Model | Ball load (t) | Feed size (mm) |
|---|---|---|
| Φ900×1800 | 1.5 | <20 |
| Φ1200×2400 | 3 | <25 |
| Φ1830×3000 | 4 | <25 |
These representative figures are drawn from standard mill product data and should be used to size media additions and estimate motor loading. Always confirm with your supplier drawings & rated motor power.
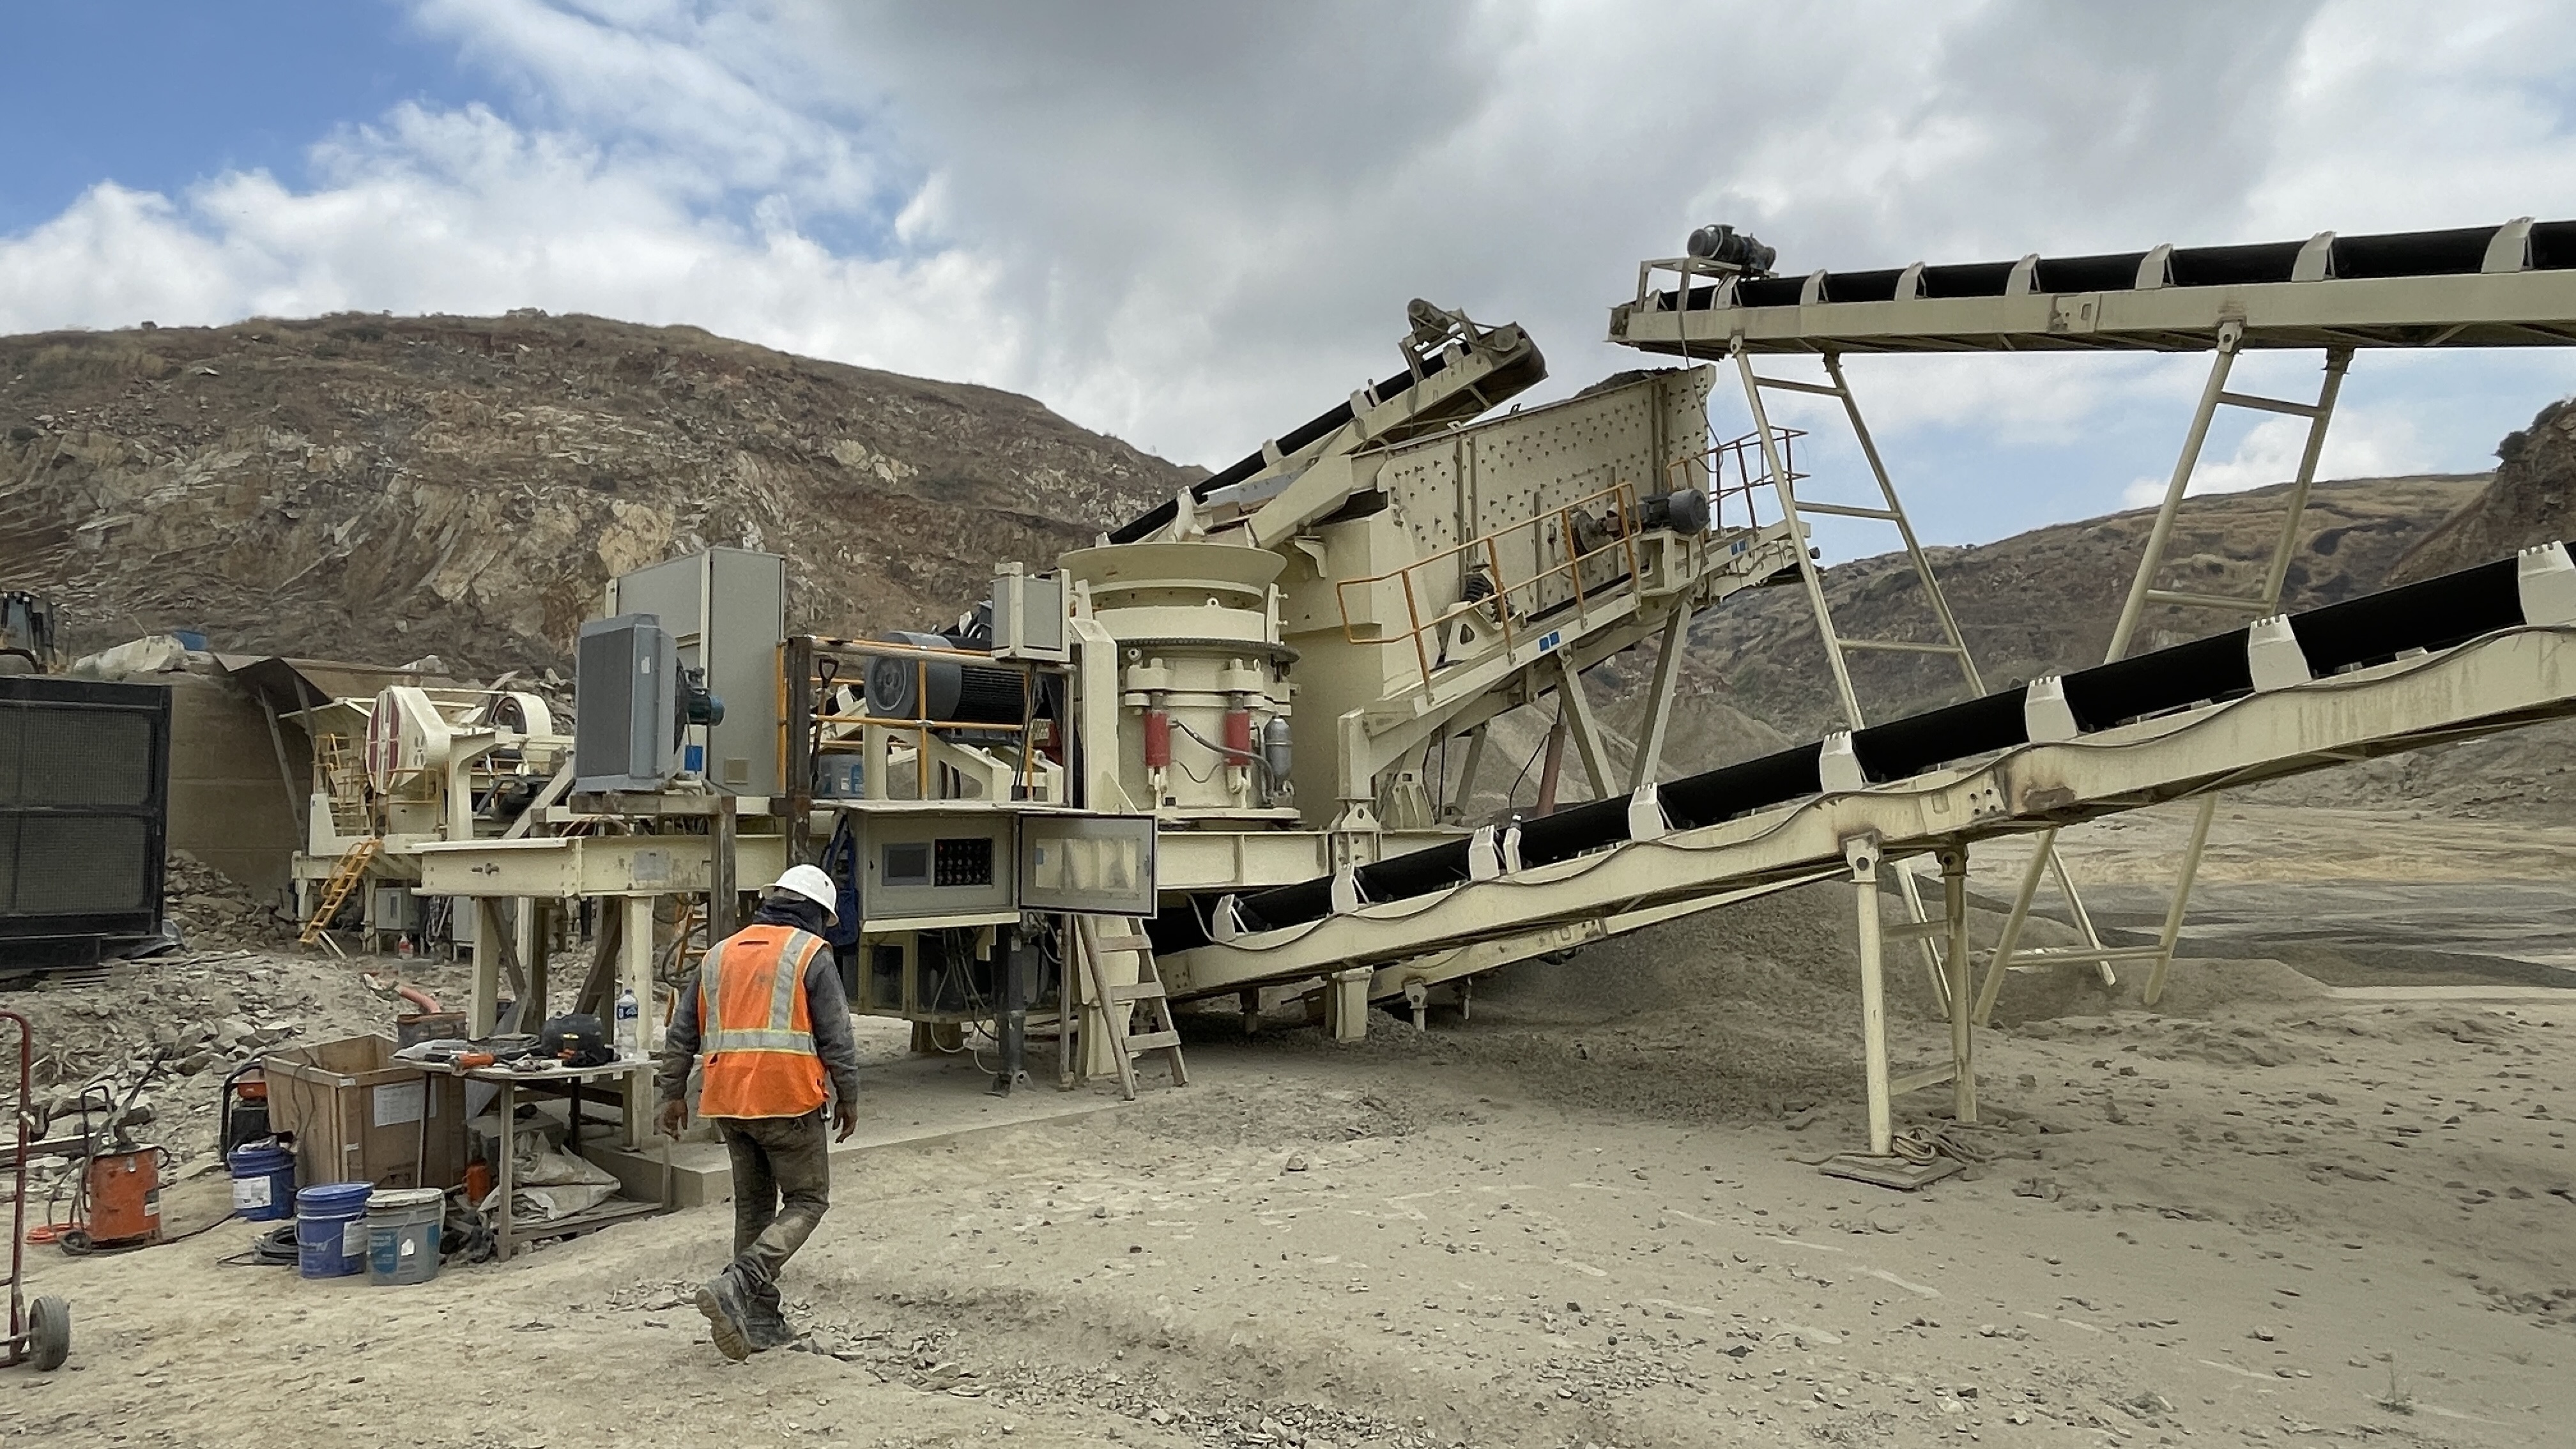
Case: a medium-hard gold circuit. Operators tracked motor power and product P80 daily. When media filling dropped 5% from baseline, P80 coarsened 12% and energy per tonne rose. Adding 0.8 t of medium balls in two lifts restored power and P80 within 48 hours. Lesson: small changes matter; use staged additions, and keep good logs.
Daily: record motor amps and feed rate. Weekly: inspect audible tone and vibration. Monthly: shutdown visual check and compare measured fill to target. Quarterly: recalibrate power-to-fill curves after liner changes or speed adjustments. This cadence balances uptime and control.
1) See symptom (coarse product / high power). 2) Check feed rate and classifier. 3) Check motor power trend. 4) If power low and product coarse — likely under-fill: add media. 5) If power high but product not improving — likely over-fill or slurry cushioning: reduce media or feed. Always change media in steps; verify with at least two independent indicators (power + visual or weight).
Charge volume control is a predictable, manageable lever. Be methodical; calibrate indicators for your mill; document every media change. With routine checks and simple maths, most mills reach stable, energy-efficient operation rapidly. The product data and installation guidance used here are consistent with common mill models and supplier documentation.
Whatsapp:+8617329420102
Email: [email protected]
Address: No. 1688, Gaoke East Road, Pudong new district, Shanghai, China.
Online Service : Get Price

We value your feedback! Please complete the form below so that we can tailor our services to your specific needs.
