Reagent costs eat up 20–35% of total flotation operating expenses in most mineral processing plants. When prices spike or recovery drops, the budget takes a serious hit. This guide walks through practical steps to cut reagent spend without hurting metal recovery.
Flotation separates valuable minerals from gangue using chemical reagents. These include collectors, frothers, depressants, activators, and pH modifiers. Each chemical plays a specific role in making target minerals attach to air bubbles.
Collectors coat mineral surfaces so they repel water. Frothers stabilize the bubble layer at the top of the cell. Depressants stop unwanted minerals from floating. Together, they control selectivity and recovery rate.
When reagent dosing is off — even slightly — you lose grade or recovery. Both outcomes cost money. So controlling reagent use is not just about cutting costs. It is about running a tighter, more stable circuit.
Several variables push reagent use higher than needed. Identifying them is the first step toward reducing spend.
Fixing these root causes often reduces reagent dosage by 10–25% with no change in recovery. That is a meaningful saving in most operations.
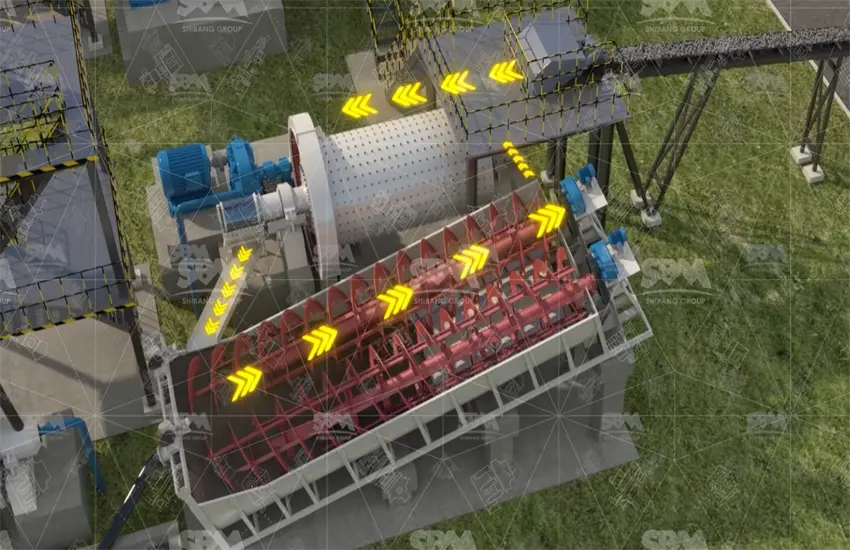
Particle size directly controls how much collector you need. The target grind for sulphide flotation typically falls between 75–150 µm P80, depending on the mineral liberation size.
Over-grinding creates slimes. Slimes have very high surface area. They consume reagents without contributing to recoverable concentrate. Industry data suggests slimes below 10 µm can consume 3–5 times more collector per unit weight than normal particles.
Under-grinding leaves locked particles. These do not float well even with higher reagent doses. You spend more and recover less.
The fix is tight grind control with online particle size measurement. Instruments like laser diffraction analyzers or acoustic sensors give real-time P80 data. When the grind shifts, the mill controller adjusts before the flotation circuit is affected. This alone can reduce reagent consumption by 8–15% in operations with variable ore hardness.
Where you add a reagent matters as much as how much you add. Collectors need contact time with the mineral surface before the particle enters the flotation cell. The standard conditioning time for sulphide collectors is 2–5 minutes at the right pulp density.
Adding collector directly into the flotation cell reduces contact time. The reagent has less chance to adsorb onto the mineral. So you add more to compensate — which inflates cost.
Moving collector addition to the conditioning tank upstream, at 65–72% solids, improves adsorption efficiency. Some operations report 12–18% reduction in collector dosage after relocating addition points without any drop in recovery.
Frothers behave differently. They work best when added close to the flotation cell feed. Adding frother too early causes it to degrade before reaching the cell, forcing higher doses.
A flotation cell that runs with wrong air rate or impeller speed wastes reagents. When air rate is too high, bubble size increases. Large bubbles have lower surface area per unit volume. They carry fewer particles and collapse faster. Operators then add more frother to stabilize the froth — driving up cost.
The optimal superficial gas velocity (Jg) for most base metal sulphide flotation is 0.8–1.5 cm/s. Running above 2.0 cm/s typically hurts both grade and frother efficiency.
Impeller tip speed affects bubble dispersion. Too slow means poor mixing. Too fast causes turbulence that breaks up loaded bubbles. The target tip speed for most mechanical cells is 5–7 m/s. Checking and adjusting impeller speed quarterly reduces chemical waste tied to poor hydrodynamics.
pH affects how collectors and depressants behave. Most sulphide collectors work best at pH 8–10. Running at pH 11 or above does not improve recovery, but it triples lime consumption.
Lime is often the highest-volume reagent in a flotation plant. In copper-moly circuits, lime additions at 2–4 kg/t are common. Dropping to pH 9.5 instead of 10.5 can reduce lime use by 30–40%, saving significant cost at high throughput.
Online pH sensors with automatic dosing control maintain tighter pH bands (±0.2 pH units) compared to manual grab-sample control (±0.8 pH units). Tighter control means less overshoot and less lime waste. The sensor and dosing pump system typically pays back within 4–8 months in high-lime operations.
Not all collectors are equal in efficiency. Xanthates are the most common sulphide collector. Short-chain xanthates (ethyl, propyl) work well for fast-floating minerals. Long-chain xanthates (isobutyl, amyl) are stronger but cost more per kilogram.
Switching from a blanket amyl xanthate dose to a split addition — ethyl xanthate in roughers, amyl xanthate as a booster in scavengers — often reduces total collector spend by 15–20% while maintaining the same tail grade.
Collector blends are another tool. Blending a dithiophosphate with a xanthate at a 30/70 ratio can improve selectivity against pyrite. Better selectivity means less depressant needed, which reduces total reagent cost even if the collector itself is slightly more expensive.
Always run laboratory tests before changing collector type. A bench flotation test with your actual ore will show you the dosage response curve and help set the minimum effective dose.
Recycled water carries dissolved ions, residual reagents, and fine solids. These species interfere with fresh reagent performance. In closed-water circuits, ion buildup can increase collector demand by 10–20% compared to fresh water.
Key ions to monitor include calcium (Ca²⁺), sulphate (SO₄²⁻), and thiosulphate (S₂O₃²⁻). High calcium depresses xanthate activity. High thiosulphate competes with collector at the mineral surface.
Blending recycled water with fresh water at a 60/40 ratio typically keeps ion concentrations below problematic thresholds. Some operations use a small bleed stream to flush excess ions. The bleed volume is usually 5–10% of total water flow.
Regular water quality analysis — weekly for major ions — gives early warning before water chemistry hurts reagent efficiency. Acting early is cheaper than increasing reagent dose after the problem develops.
This is a question many operations avoid asking. Dosing pumps drift. Flowmeters foul. Manual dilution is inconsistent. The result is actual reagent delivery that differs from the setpoint by 15–30%.
Checking dosing accuracy monthly catches drift before it becomes a cost problem. Use a calibration cylinder — fill it for 60 seconds and measure actual volume. Compare to the pump setpoint. A 10% deviation means either overdosing or underdosing, both of which cost money.
Dilution systems also need attention. Concentrated reagent must be diluted accurately before addition. If the dilution water flow varies, the actual reagent concentration in the diluted stream changes. This makes dosage control harder and forces operators to overdose as a buffer.
Installing magnetic flowmeters on reagent dilution lines, rather than rotameters, improves dilution accuracy from ±10% to ±1%. This small investment improves dosing control across the whole circuit.
A copper flotation plant processing 8,000 t/d of porphyry ore faced high collector costs. The ore had variable hardness between 12–18 kWh/t. Feed grade averaged 0.52% Cu.
Problem: Collector dosage was running at 78 g/t SIPX. Operators increased dose manually when feed went hard. Dosage sometimes hit 110 g/t during hard ore periods.
Actions taken:
Results after 6 months:
The plant metallurgist noted that stable grind control was the single biggest factor. “Once the mill ran consistently, we stopped chasing the reagents,” was the feedback from the operations team.
A 3,500 t/d lead-zinc plant used high lime additions to depress zinc during lead flotation. Lime consumption averaged 6.2 kg/t — well above the 3.5–4.5 kg/t typical for similar ores.
Root cause found: pH probes in the conditioning tank had fouled. Actual pH was running at 11.8 instead of the target 10.5. Operators were adding lime against a false low reading.
Fix applied:
Results within 3 months:
The maintenance supervisor said the self-cleaning probes were “much less trouble” than the old units, which needed manual cleaning every shift. Total reagent cost saving was roughly USD 280,000 per year at that plant.
Cutting reagent cost blindly can hurt recovery. The goal is to find the minimum effective dose — not the lowest possible dose. These are different things.
A dose-response curve for each reagent in your circuit tells you where the flat part of the curve begins. Below that point, recovery drops steeply. Above it, you are spending money with no benefit. The optimal dose is just at the knee of the curve.
To build a dose-response curve, run a series of locked-cycle flotation tests in the lab with your current ore. Vary the collector dose from 30% below current to 30% above. Plot recovery vs. dose. The shape of the curve tells you how much headroom you have to reduce dose without losing recovery.
In most base metal circuits, the optimal collector dose is 10–25% below what plants actually run. The gap exists because operators add buffer to protect against feed variation. Fixing feed variability — through better ore blending or tighter grind control — shrinks that buffer and lets you operate closer to the true optimum.
Flotation cell design affects reagent efficiency. Cells with better bubble-particle contact reduce the collector dose needed to achieve the same recovery. Smaller, more uniform bubbles improve collection efficiency because they have more surface area per unit volume.
Column flotation cells, for example, use wash water to clean the froth layer. This reduces entrainment of gangue particles. Less entrainment means less depressant needed to maintain grade. Column cells are especially effective in cleaner stages.
Mechanical cell impeller design also plays a role. Impellers that produce a tight bubble size distribution (0.5–1.5 mm) improve reagent utilization compared to older designs that produce a wide distribution (0.5–4 mm). Upgrading impellers in existing cells is a lower-cost option than replacing entire machines.
When selecting new flotation equipment, ask the manufacturer for bubble size distribution data at operating Jg values. This data tells you how the cell performs in terms of reagent efficiency — not just throughput.
Most plants still dose reagents based on shift averages or operator experience. That approach works, but it is not tight enough to minimize cost. Better control requires real-time data.
Online analyzers now measure pulp potential (ORP), pH, and dissolved oxygen continuously. These parameters tell you how active the flotation chemistry is in real time. Linking these measurements to automatic dosing control — a feedback loop — reduces overdosing significantly.
Some advanced plants use machine learning models trained on historical data to predict optimal reagent doses based on feed grade, hardness, and water chemistry. These models can cut reagent use by 12–20% compared to fixed-setpoint control, while improving recovery consistency.
The capital investment for online sensors and control upgrades is typically USD 150,000–400,000 for a medium-size plant. The reagent savings alone usually justify the cost within 18–30 months.
| Method | Typical Cost Reduction | Recovery Impact | Implementation Difficulty | Payback Period |
|---|---|---|---|---|
| Grind size control (online sensor) | 8–15% | Neutral to positive | Medium | 6–18 months |
| Reagent addition point optimization | 10–20% | Neutral to positive | Low | 1–3 months |
| pH control automation | 15–40% (lime) | Neutral to positive | Low–Medium | 4–10 months |
| Collector type / blend change | 12–22% | Neutral | Medium (lab testing needed) | 2–6 months |
| Water chemistry management | 8–18% | Neutral | Low–Medium | 3–8 months |
| Dosing pump calibration program | 5–15% | Neutral | Low | 1–2 months |
| Online ORP/pH feedback dosing | 12–20% | Positive | High | 18–30 months |
| Cell aeration optimization | 8–15% (frother) | Neutral to positive | Low | 1–4 months |
This is the most common concern operators raise. The answer is usually: you are cutting dose without fixing the underlying inefficiency first.
If your cell hydrodynamics are poor, you need more reagent to achieve adequate mineral-bubble contact. If you cut dose without fixing the cell, recovery drops. The reagent is compensating for a mechanical problem.
The correct sequence is: fix the mechanical problem first, then reduce the dose. Optimize the cell air rate and impeller speed. Then reduce the collector by 5% and monitor the tail grade. If the tail holds, reduce another 5%. This stepwise approach keeps recovery stable while finding the true minimum dose.
Most operations that follow this sequence find they can reduce dose by 15–25% without hurting recovery. The key is to separate the mechanical variables from the chemical variables before making dosage changes.
Variable ore is the main reason operators run with a large reagent buffer. When hardness or mineralogy shifts, operators increase dose reactively. The buffer builds up over time and becomes the “normal” operating dose — even when ore is easy.
A better approach is to classify the ore feed before it reaches the plant. Ore tracking systems — using blast hole data, grade control sampling, or XRF belt analyzers — give advance notice of what ore is coming. With 4–8 hours of warning, the flotation operator can adjust dosing proactively rather than reactively.
This changes the dynamic from “add more when things go wrong” to “adjust dose to match incoming ore type.” Studies in copper and gold flotation show this approach reduces average collector dosage by 10–18% compared to reactive control, with better recovery consistency.
Ore blending at the stockpile stage also helps. Mixing high-grade and low-grade ore reduces feed variability before it enters the mill. Tighter feed grade variance means less need for a large reagent buffer in the flotation circuit.
Many operations look only at reagent purchase price per kilogram. But the true cost includes several other factors that are easy to miss.
A full-cost accounting approach — tracking all reagent-related costs, not just purchase price — gives a clearer picture of where the real savings are. Often, fixing dosing accuracy and reducing waste is more valuable than negotiating a lower price per kilogram.
Changing reagent addition points, installing online sensors, or upgrading cell components all require proper commissioning to deliver results. A staged implementation reduces production risk.
For reagent addition point changes, the modification can usually be done during a planned maintenance shutdown. Commissioning involves a 2–4 week monitoring period to verify that recovery holds at the new lower dose before claiming the saving.
For online sensing and automated dosing upgrades, commissioning typically takes 4–8 weeks. The first 2 weeks involve sensor calibration and baseline data collection. Weeks 3–8 involve tuning the control loops and verifying performance against manual sampling.
Ongoing support matters. Sensors drift. Pumps wear. Control models need retraining as ore changes over time. Having a service agreement or in-house capability for quarterly calibration checks protects the investment and keeps savings on track.
We provide full commissioning support and can supply replacement wear parts, sensors, and control system upgrades as your operation evolves. Our technical team is available for on-site audits if reagent costs are rising unexpectedly.
Some changes show results almost immediately. Moving a collector addition point upstream gives measurable improvement within 24–48 hours. pH control automation reduces lime use within the first operating week. Grind optimization takes longer — usually 2–4 weeks — because you need to see performance across different ore types before the saving is confirmed. The fastest wins come from fixing dosing accuracy and addition points. More complex changes like collector reformulation or automated feedback control take 4–12 weeks to fully commission and verify.
Not if done correctly. The key is to reduce dose after improving cell performance, not before. Cells that run at the right air rate, correct impeller speed, and proper pulp level are more efficient — they achieve the same recovery at lower reagent dose. If you reduce dose without improving cell efficiency first, yes, recovery will drop. The stepwise approach — fix mechanical variables, then reduce dose in 5% increments while monitoring tail grade — protects recovery throughout the optimization process. In well-run circuits, recovery often improves slightly when dose is optimized, because selectivity increases at the correct dose.
Yes, and variable ore operations often have the most to gain. The reason is that operators in variable-ore plants typically run large reagent buffers — sometimes 30–50% above the true optimum — to handle worst-case ore. With better ore characterization upstream and proactive dose adjustment, that buffer can be cut significantly. The investment in ore tracking or feed analysis usually pays back from reagent savings alone within 6–12 months. Flotation circuits that process ore blended at the stockpile see even faster results, because feed variability drops before the reagent optimization even starts.
Reagent costs in flotation are controllable. The methods described in this guide — grind optimization, addition point adjustment, pH automation, collector selection, and dosing accuracy — are all proven in operating plants. Most require modest capital. All deliver measurable results.
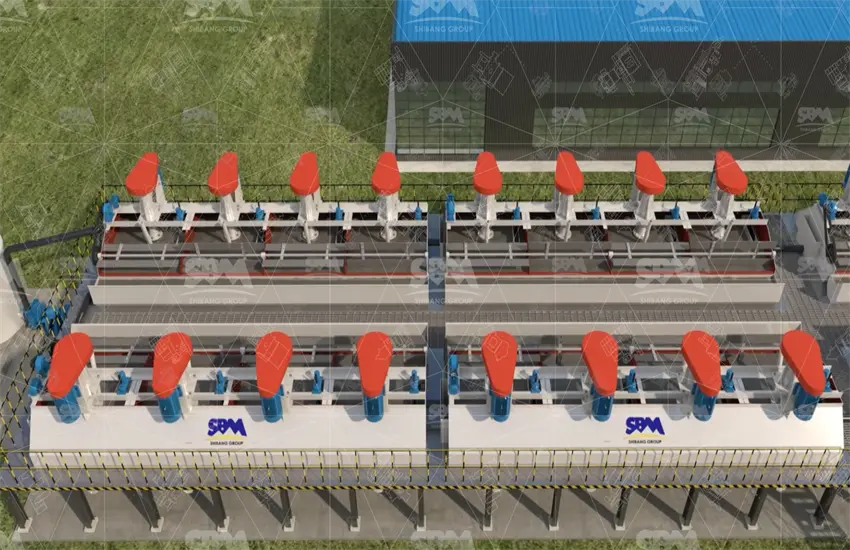
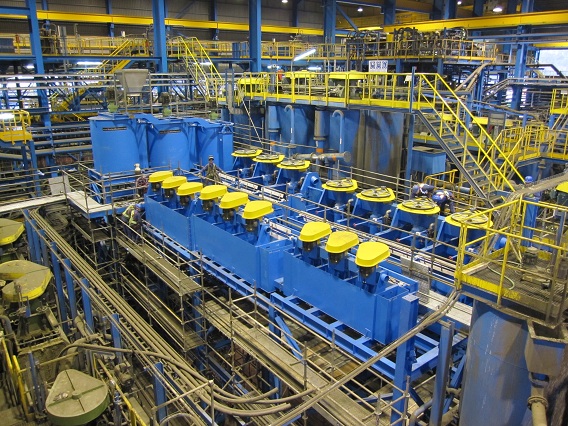
We manufacture flotation cells, conditioning tanks, and associated process equipment designed to maximize reagent efficiency. Our equipment is engineered for consistent bubble size distribution, stable air rate control, and easy impeller maintenance. We also support process audits to identify where your specific circuit is losing reagent efficiency.
If you want to reduce reagent costs without risking your metal recovery, contact our team. We can review your current circuit, identify the highest-impact opportunities, and propose a phased implementation plan matched to your shutdown schedule and budget. Every operation is different — we build solutions around your ore, your process, and your targets.
Whatsapp:+8617329420102
Email: [email protected]
Address: No. 1688, Gaoke East Road, Pudong new district, Shanghai, China.
Online Service : Get Price
We value your feedback! Please complete the form below so that we can tailor our services to your specific needs.
